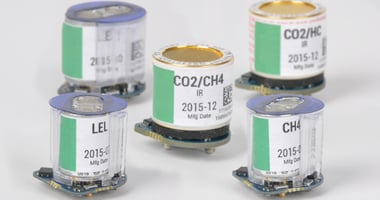
One of the most significant dangers to workplace safety comes from toxic, combustible, and asphyxiant gases. It can be challenging to identify which gases are present in your work setting, but there are several options available to detect them in your facility.
What is Gas Sensor Cross Sensitivity?
Gas sensor cross sensitivity is the tendency of a gas sensor to detect the presence of a gas other than the one it is specifically monitoring. This can lead to false readings, such as an H₂S sensor picking up H₂ gas in the area.
The following chart outlines electrochemical sensor cross interference levels.
| Sensor | CO | CO (H2 Low) |
H2S (Ventis) |
H2S (Tango, MX6) |
SO2 | NO2 | Cl2 | ClO2 | HCN | HCl | PH3 | NO | H2 | NH3 |
| Carbon Monoxide (CO) |
100% | 100% | 1% | 1% | 1% | 0% | 0% | 0% | 0% | 0% | 0% | 0% | 20% | 0% |
| Hydrogen Sulfide (H2S) |
5% | 5% | 100% | 100% | 1% | -40% | -3% | -25% | 10% | 300% | 25% | 10% | 20% | 25% |
| Sulfur Dioxide (S02) |
0% | 5% | 5% | 5% | 100% | 0% | 0% | -5% | 10% | 40% | -1% | 0% | 0% | -40% |
| Nitrogen Dioxide (N02) |
-5% | 5% | -25% | -25% | -165% | 100% | 45% | 50% | -70% | -- | -11% | 30% | 0% | -10% |
| Chlorine (Cl2) |
-10% | 0% | -20% | -20% | -25% | 10% | 100% | 60% | -20% | 6% | -20% | 0% | 0% | -50% |
| Chlorine Dioxide (ClO2) |
-- | -- | -- | -- | -- | -- | 20% | 100% | -- | -- | -- | -- | -- | -- |
| Hydrogen Cyanide (HCN) |
15% | 5% | -1% | -5% | 50% | 1% | 0% | 0% | 100% | 35% | 4% | 0% | 30% | 5% |
| Hydrogen Chloride (HCl) |
3% | -- | 0% | 0% | 5% | 0% | 2% | 0% | 0% | 100% | 0% | 15% | 0% | 0% |
| Phosphine (PH3) |
80% | 415% | 60% | 55% | 20% | -130% | -225% | -100% | 425% | 300% | 100% | 10% | -30% | 15% |
| Nitric Oxide (NO) |
25% | 40% | 1% | -0.2% | 1% | 5% | 10% | -- | -5% | -- | -1% | 100% | 30% | 0% |
| Hydrogen (H2) |
22% | 3% | 0.3% | 0.08% | 0.5% | 0% | 0% | 0% | 0% | 0% | 0% | 0% | 100% | 0% |
| Ammonia (NH3) |
0% | 0% | 0% | 0% | 0% | 0% | 0% | 0% | 0% | 0% | 0% | 0% | 0% | 100% |
| Acetylene | 202% | 177% | 0% | 0% | 138% | 0% | -- | -- | -- | 8% | -- | -- | -- | -- |
| Ethylene | 77%* (100%) | 55%* | 0% | 0% | -- | -- | -- | -- | -- | -- | -- | -- | -- | -- |
| Ethanol | 0%* (50%) | 0%* (65%) | 0% | 0% | -- | -- | -- | -- | -- | -- | -- | -- | -- | -- |
| Methyl Mercaptan | -- | -- | -- | 77% | -- | -- | -- | -- | -- | -- | -- | -- | -- | -- |
| Ethyl Mercaptan | -- | -- | -- | 34% | -- | -- | -- | -- | -- | -- | -- | -- | -- | -- |
* new sensor() aged sensor or saturated filter
Table is current as of July 15, 2019
1. The table above reflects the percentage response provided by the sensor listed across the top of the chart when exposed to a known concentration of the target gas listed in the left hand column. “—” means no data available.
2. The specified cross interference numbers apply to new sensors only and may vary with time. They also vary from sensor to sensor.
3. The numbers are measured under environment of 20 °C, 50% RH and 1 atm.
4. This table is given as a reference only and is subject to change.